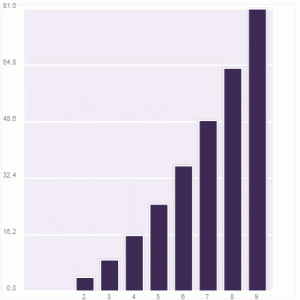
to generate the charts.
To obtain the URL, open the spreadsheet, click on "Publish" and then on "Publish now" and "More publishing options". Select the ATOM format and generate the URL. You'll need to copy the URL and introduce it here.
If you don't want to have a public spreadsheet, go to "Publish" again and click on "Stop publishing".

*Note: the site only looks at the first two columns, that need to have a header with two cells that contain "x" and "y" (here's an example of accepted spreadsheet).


